Impact of input and milk price changes on the profitability of different dairy systems in Northern Ireland
Date published:
Dairy farming has experienced significant increases in feed, fertiliser and energy costs recently, with knock-on effects on the costs of production. However, milk price has also increased.

Background
How these changes effect overall profitability and how the impacts vary for different production systems is of interest to dairy farmers and the wider dairy supply chain. Using the recently developed AFBI Dairy Systems Model, the impact of price changes on the profitability of different dairy systems typically found in Northern Ireland was assessed.
The study
Three different dairy systems were examined in this study - Low, Medium and High. In the Low system, cows calved in the Spring (February, March, April) and produced 6,000L per lactation. Cows were outdoors from March to October on a diet of grazed grass and concentrate and indoors from November to February on a diet of grass silage and concentrate. In the Medium system cows calved in the autumn (September/October) and Spring (March/April) and produced 8,000L per cow. Cows were outdoors from April to September on a diet of grazed grass and concentrate and indoors from October to March on a diet of grass silage and concentrate. In the High system cows calved all year round and produced 10,000L per cow. Lactating cows were housed fulltime on a diet of grass silage and concentrate, only dry cows and heifer replacements were outdoors on grazed grass and concentrate. Farm size was assumed to be 70ha and stocking rate was set equivalent to a carrying capacity of 170kg organic N/ha. The effects of changing milk, concentrate, fertiliser and electricity prices on the profitability of the three systems was analysed. Taking recent price trends into account, for this study milk price was initially set at 40ppl, concentrate price was set at £400/t and fertiliser was set at £650/t.
Results
Table 1 outlines the physical results from the study. The High system produced the largest volume of milk, had the highest feed requirement and, therefore, carried the lowest number of cows on the fixed land base of 70ha.
Table 1. Physical outputs of dairy systems studied using the AFBI Dairy Systems Model
| Low | Medium | High | |
| Area farmed (ha) | 70 | 70 | 70 |
| Stocking rate (CE/ha) | 1.77 | 1.78 | 1.79 |
| Milk yield (L/cow) | 6,058 | 8,009 | 10,031 |
| Average number cows | 101 | 98 | 95 |
| Total milk produced (L/farm) | 618,586 | 781,061 | 953,635 |
| Concentrate fed (kg/cow) | 1,032 | 2,008 | 3,313 |
| Grazed grass (kgDM/cow) | 3,603 | 2,963 | 1,261 |
| Grass silage (kgDM/cow) | 2,245 | 3,879 | 6,975 |
Table 2 outlines the financial results for the study. The Medium system was found to have the highest net profit per farm and cow using the reference input costs and milk price, with the Low system having the smallest net profit per farm and cow. However, net profit per litre was highest for the Low system.
Table 2. Profitability of dairy systems using the AFBI Dairy Systems Model
| Low | Medium | High | |
| Sales (£/farm)1 | 274,532 | 340,839 | 406,295 |
| Variable costs (£/farm)2 | 125,665 | 176,763 | 246,003 |
| Gross margin (£/farm) | 148,867 | 164,076 | 160,293 |
| Fixed costs (£/farm)3 | 74,895 | 76,494 | 78,007 |
| Net profit (£/farm) | 73,972 | 87,583 | 82,285 |
| Net profit (£/cow) | 732 | 894 | 866 |
| Net profit (ppl) | 12 | 11 | 9 |
1 Milk price 40ppl, 2 Concentrate price £400/t, Fertiliser price £650/t,
3 Electricity price £0.25/kwh
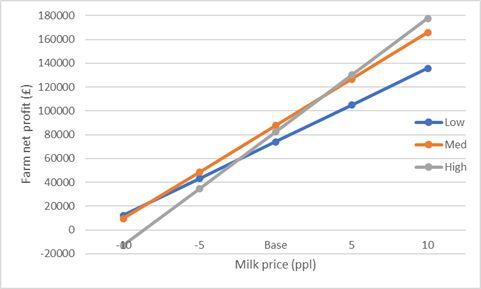
The effects of changing milk, concentrate, fertiliser and electricity price were examined with the results shown in Table 3. The net profit changed by the amount shown in the table whether it was an increase or decrease in the price, e.g. if milk price increased or decreased by 5ppl, net profit increased or decreased by £30,929 for the Low system. All price changes had the biggest effect on the High system and the smallest effect on the Low system, reflecting the level of inputs and milk sales from these systems. Overall, in this analysis milk price changes had the largest effect on profitability, followed by concentrate price changes, then fertiliser price changes, with electricity price changes having the smallest effect on profit. The range of cost and price changes included in the analysis resulted in a re-ordering of the profitability of the systems, depending on the level and combination selected, as shown in Figures 1 and 2.
Table 3. Effects of changing milk, concentrate, fertiliser and electricity price on the net profit of dairy systems using the AFBI Dairy Systems Model
| Impact on farm net profit (£) | Low | Medium | High |
| Milk price (+/-5ppl) | 30,929 | 39,053 | 47,682 |
| Concentrate price (+/-£20/t) | 2,652 | 4,010 | 5,718 |
| Fertiliser price (+/-£50/t) | 2,180 | 2,570 | 2,768 |
| Electricity price (+/-5p/kwh) | 1,667 | 1,795 | 1,907 |


Changes in fertiliser price and electricity price did not result in a re-ranking of the profitability of the three systems studied.
Conclusions
This analysis illustrates how the interplay of input price and milk price changes impacts profits for a number of common Northern Ireland dairy systems. In the baseline scenario, the Medium system (autumn/spring calving, 8,000l/cow) was the most profitable. It also remained the most profitable across most of the price changes examined. Profitability of the High system was the most sensitive to price changes and the Low system the least. Changes in milk and concentrate price can cause re-ranking of the systems in terms of overall farm profitability.
This analysis considered how financial factors influence farm profitability, however, the AFBI Dairy Systems Model also allows analysis of how changes in physical and technological factors impact farm performance. Work is also underway to consider the environmental impact of the systems alongside profitability. Going forward, this will provide an important research tool informing and supporting decision-making.by dairy farmers and policy makers in Northern Ireland.
Notes to editors:
AFBI is an arms-length body of DAERA delivering research and development, diagnostic and analytical testing, emergency response capability and expert scientific advice for DAERA and other government departments, public bodies and commercial companies in Northern Ireland, and further afield.AFBI’s Vision is “Scientific excellence delivering impactful and sustainable outcomes for society, economy and the natural environment”.AFBI’s Purpose is “To deliver trusted, independent research, statutory and surveillance science and expert advice that addresses local and global challenges, informs government policy and industry decision making, and underpins a sustainable agri-food industry and the natural and marine environments”.AFBI’s core areas:Leading improvements in the agri-food industry;Protecting animal, plant and human health;Enhancing the natural and marine environment.